Monday, December 15, 2014

How to write analysis captions.

Presenting the data may be the most important part of an experiment. In science, the analysis of the data will present the results of your experiment to your audience. To maintain scientific rigor, it is important to be transparent and reveal everything - the "good" and the "bad"!

Calculations and Summarizing Data

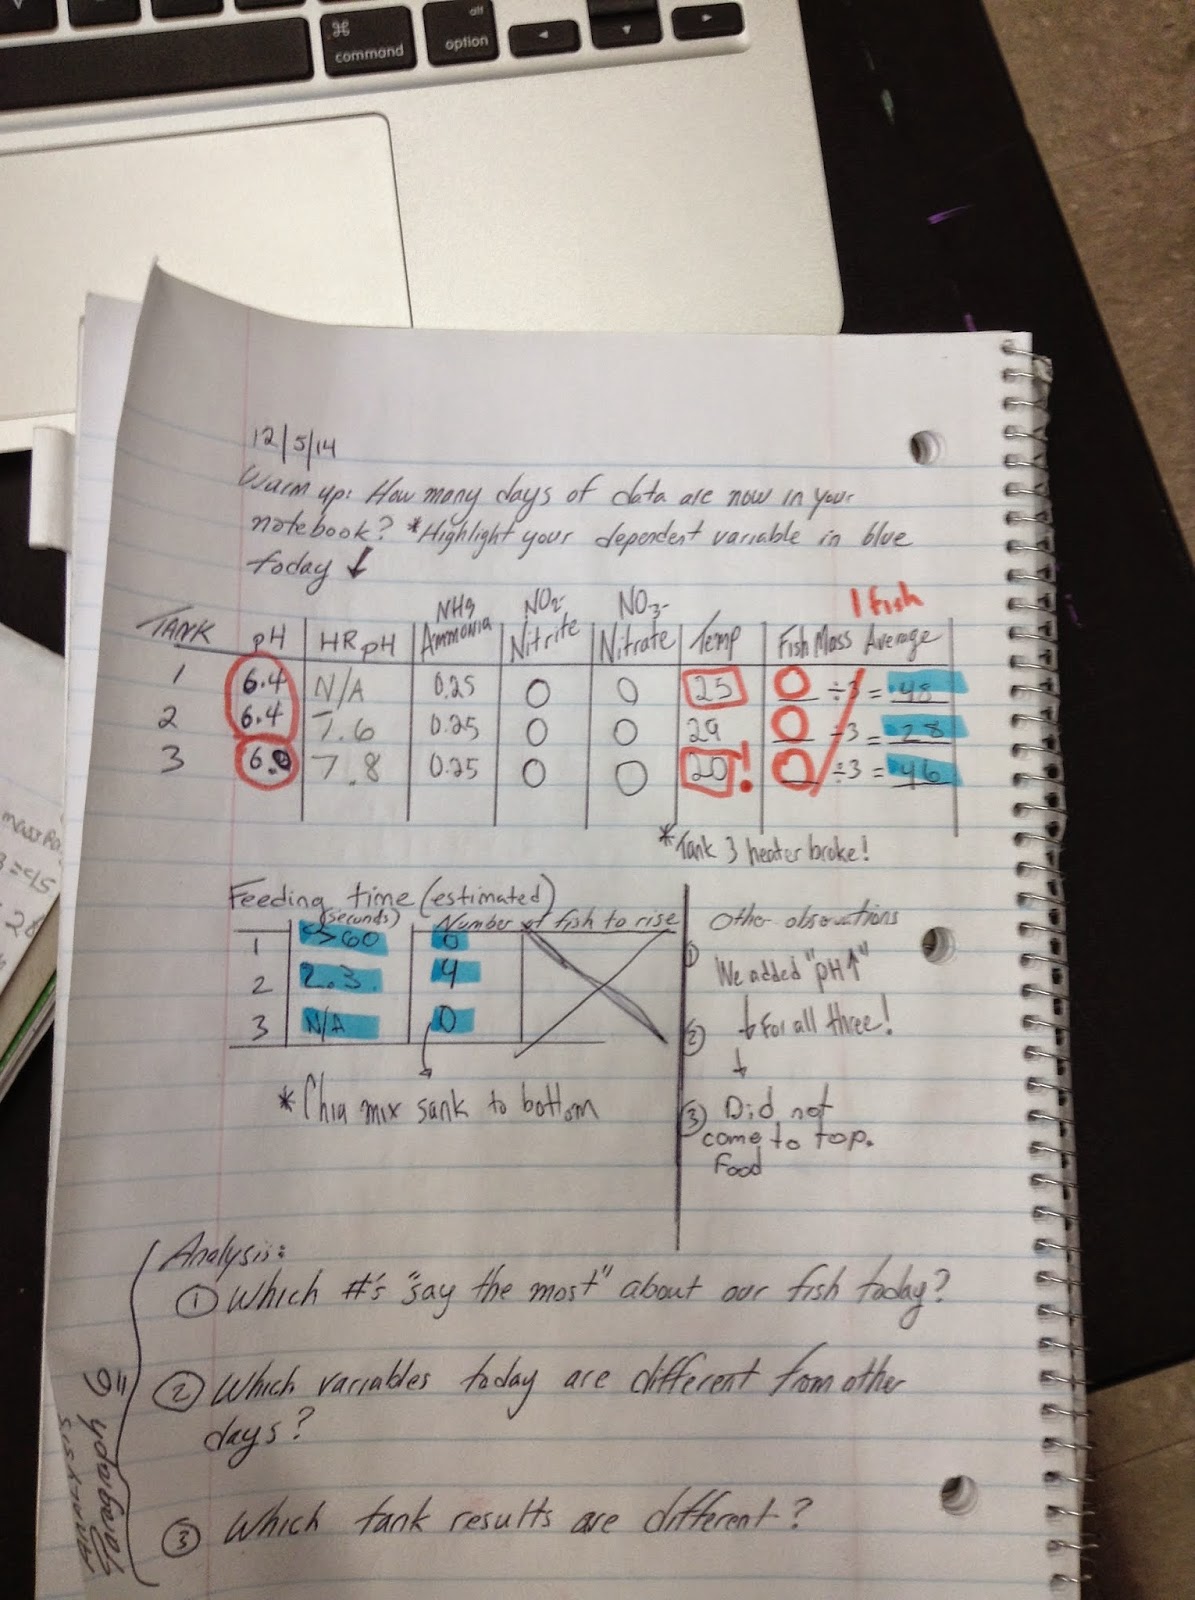
You will need to perform calculations on your raw data in order to get the results and to generate a conclusion. A spreadsheet program is a good way to perform such calculations, and then later the spreadsheet can be used to display the results. Be sure to label the rows and columns--and don't forget to include the units of measurement (grams, centimeters, liters, etc.)
You should have performed multiple trials of your experiment. Think about the best way to summarize your data. Do you want to calculate the average for each group of trials? Should you summarize the results using percentages? Where does an error analysis come in? Is it better to display your data as individual data points or use averages?


Do any calculations that are necessary for you to analyze and understand the data from your experiment.
  • Use calculations from known formulas that describe the relationships you are testing. (Rate = change in magnitude / change in time.) Or use averaging!
  • Pay careful attention to your units.


Graphs

Graphs can be used to present your results in different ways. (The science PBAT requires tables, charts and graphs!) What kind of graph is best for your data?
  • Bar graphs are used when comparing groups, variables or sets of trials.
  • Line graphs are best at showing trends of something over time, or over distances.
  • Scatterplot graphs are useful when trying to see if a pattern or relationship exists between the data sets.


And lastly, for any type of graph:
  • Generally, you should place your independent variable on the x-axis of your graph and the dependent variable on the y-axis.
  • Be sure to label the axes of your graph— don't forget to include the units of measurement (grams, centimeters, liters, etc.).
  • If you have more than one set of data, show each series in a different color or symbol and include a legend with clear labels.

Results
To write the analysis (Results) section of your paper;
1. Think about what tables you want in your paper.    
2. Enter all your data into your new data tables for your paper. Leave space for captions between each one.
2. Make graphs of your results. Which data will look "better" with a graph?
3. You must make at least 3 tables and 2 graphs of the data , and put those into your paper.

Write captions of the data for every table, chart and graph;
  • Briefly introduce the data, the source of the data. Write as if you are teaching someone who is unfamiliar with the project - what are we looking at?
  • Describe each variable being measured by identifying the unit of measurement and scale or range for each.
  • What comparisons can you make? What looks faster or slower? What is heavier or lighter? Be specific and refer to numbers.
  • Write about bias, errors, level of significance, accuracy, precision, and the range of error for every measurement!
* Refer to specific dates or numbers in your data * Use complete sentences.

Thursday, December 11, 2014

Paragraph for Data Analysis - please add to your results section.

What is the rate of growth of our tilapia? Use the length of the fish divided by the time. Then, use the mass of the fish divided by the time.

Rate is = a change in magnitude per a change in time. For our fish, our magnitude can be size or mass, and our time is the number of days.

How many days was our experiment - check your data!

Wednesday, December 10, 2014

Three New Data Charts!

Your goal is to make three charts that present the data about our Tilapia.
These charts will present data about fish size and mass over time, but require you to check for the average.

For fish size: Find largest fish and smallest fish for each day, and average those two numbers for average fish size. On days when only one number is given, use that number as the average size.

For fish mass: Copy the average mass for each day. Make sure you do not copy the total mass for three fish. 

An example of the first chart looks like this...

Tank 1Av. Fish Size (centimeters)Av. Fish Mass (grams)
10/28/20146.414
11/7/20145.418
11/14/20146.516.7
11/21/20148.118.7
12/3/2014NAna
12/5/20149.848
Overall Average????
  
Find the answer to those question marks - what is the average of each column? 

Create one more table for Tank 2, and one for Tank 3. Once we have that data, we can really see which tank resulted in faster growth for our fish. We can also calculate the rate of growth for each tank, which is the amount of growth in the total number of days (39 days total?)

Tuesday, December 9, 2014

Notes from the nutrition information for food types. 
*No information on Algae nutrition - you will have to look that up yourself!


Friday, December 5, 2014

Data Pages from Tom's Notebook


Diagram of Nitrogen Cycle


Steps for mixing fish food.

Algae
Cut algae sheets into the smallest pieces you can. 
Label your baggie “algae pieces”
Place your pieces into the baggie.

Chia Station
Grind Chia seeds into a powder.
Label your baggie “ground chia”
Place the powder into the baggie 
Deliver the powder to the weighing station.

FM Station
Grind FM into a powder. 
Label your baggie “ground FM”
Place the powder into the baggie
Deliver the powder to the weighing station.

Weighing station
1. Weight out 6.7 grams whole FM #2, place into baggie
Label baggie “whole FM #2, tank 1, 6.7 grams” 
2. Weight out 5 grams ground FM, and add 1.7 grams ground chia powder.
Label baggie “chia mix, tank 3, 6.7 grams”
Deliver baggie to the mixing station.
3. Weight out 5 grams ground FM, and add 1.7 grams pieces of algae.
Label baggie “algae mix, tank 2, 6.7 grams.” 
Deliver baggie to the mixing station.

Mixing station
Take the bags from the Weighing station. 
Be careful  - do not mix different bags together.
Follow the instructions on the “recipe” sheet.

Wednesday, November 26, 2014

Description of the Independent Variable

This is the description of our independent variables, also can be used in your procedure for feeding the fish.

Tank 1: 100% fish meal,47% protein, 3x day, 1.5 grams.

Tank 2 : 75% fish meal/25% Algae , ~44% protein, 3x day 1.5 grams, 
(we do this for 2 weeks then change to 25% kale)


Tank 3: 75% fish meal/25% Chia,~ 27% protein,3x day 1.5 grams, 
(we do this for 2 weeks then change to 25% Quinoa)

Thursday, November 6, 2014

Results of Consensus Discussion!

Hey Marine Biology students, here are some notes from discussion to reach consensus on the Tilapia experiment;

Round table discussion;
Daryl - constant tank with same food, other tanks change food
Jason - three tanks at 26degree,  changing the food is ok
Franco - three different food types over six weeks, every two weeks, change food type. All food must be researched in advance. Both mass and breeding rates.
Mark - keep the food same in each tank, but offer different food types in each tank.
Edgar - how would fish react (which will they eat, which will they spit out) given different food types. See which food will cause certain habits to change, and record mass. Change all of
Christina - changing the timing of the day that feeding happens. If fish are having trouble gaining weight. Cool with
Jada - is cool with us focusing on the food types.

Use this to write your introduction, variables, and hypothesis; 
This Tilapia experiment will use food types as the independent variable. This will include a control tank (tank #1) using the existing mixed feed, a vegetable based feed (tank 2) and a seed/grain based feed (tank #3). For the first three weeks, Tank 2 will use a mix of protein, with a kale / algae mix, and tank 3 will use a mix of sprouted quinoa and chia seed.  The dependent variables are the size (mass and length) of the fish, the color of the fish, any breeding that happens, as well as the behaviors of the fish, such as aggression and breeding.  The controlled variable all three tanks at 26 degrees celsius, and over the next six weeks, raise the temperature 3 degrees every 2 weeks. There are several other controlled variables we must identify.

Tuesday, October 28, 2014

Tilapia Research Paper Outline

Hello Marine Biology Students,
Please use this outline when writing your research paper on Tilapia. You can copy and paste this information or type it into you paper yourself. First, set up a "new document" in google drive, and share this with Tom. Title the new document, "your name Tilapia research paper.

What is due TODAY:
1. This outline copied into your document, shared with Tom.
2. The Experimental Design Section, first draft.

The OUTLINE

Experimental Question and Introduction

Background Research (This will be revised MEATy paragaphs, notes from class, and additional information you research. 2-10 pages.)

Hypothesis (What prediction will you design your experiment around? The hypothesis must include specific ideas about cause and effect. It must also be based on something you read.)

Experimental Design Section (This section can be anywhere from 1-5 pages)
1. Description of the Variables (paragraphs describing the independent, dependent, and controlled variables.)

2. Set up (This is a paragraph or two about how to set up the experiment. Also, a diagram showing what the set up is.)

3. Timeline

4. Procedure (detailed steps and instructions on how to run the experiment, from start to finish. How to move fish, how to take water chemistry samples, how to measure fish, how to use the automatic feeders and so on. See procedure assignment from Oct. 23rd in your notebook. Usually also shows diagrams of how the procedure will happen.)

5. Forms of Error and Bias (This is a combination of your observation about what IS causing errors in our measurements, and what you think WILL be sources of error in the future. Usually this section is a few paragraphs.)

Results (The data collected on the dependent variables. Data collected on controlled variables. Must be in table form. This is in the spreadsheet document instead of your paper. We will copy and paste it from that document when the experiment is over.)

Analysis and Conclusion (Graphs, tables, and written analysis and a conclusion.)

Discussion (Paragraph about revisions and future research questions.)

Works Cited / Bibliography 


Friday, October 24, 2014

Data Collection - Google Docs Spreadsheet!

Today we are going to transfer our data into google spreadsheets!
Our first step is to use Franco's model sheet to set up your own spreadsheet in google docs.
Then share the document with Tom, at samot46@gmail.com.
Title your sheet, "Tilapia Data your name"

STEP TWO
practice measurement using these photos (instead of Tom printing them)

Measure the head to tail, to the tenths place in centimeters. (please do not draw on the laptops.)


STEP THREE
Record the pH, ammonia, nitrite, and nitrate for all three tanks.
Record the temperature in celsius for all three tanks.


Wednesday, September 24, 2014

Tuesday's Notes on Living Things and Fish

Presentation from Tuesday's class, September 23rd.

This should be page 12 or 13 of your notebook.

(If you missed class, see other students for the complete notes.)

Monday, September 22, 2014

Journal Organization from Week 2

Cover:
Name and Marine Biology
Year

First Page:  Table of Contents

Pages 2-6 Skip, but number them.

Page 7  At the top write today’s date – Sept. 17, 2014
What lives in the ocean?
What is the range of biodiversity living in each ocean environment?
New Vocabulary 
Biology: Bio means living things, ology means the study of, biology is the study of living things.

Biodiversity: a diverse amount of living things. How many different living things are in an ecosystem.

Ecosystem:  needs a definition

Page 8  Introduction to Concept Maps
Page 9  Rubric for concept maps
Page 10  Concept Map first draft
Page 11  Concept Map Final Draft 


Monday, September 15, 2014

Welcome to Tom's Marine Biology Course!

It is now official, the course will offer the PBAT assignment, instructions, revisions, and presentation support throughout October, November and December. PBAT presentations will happen in January.

All students, (including students who need the PBAT) will be required to meet all the challenging tasks ahead of us this semester. Passing the PBAT does not equate to passing the class. However, if you are failing the class, you cannot present the PBAT.

Talk to Tom if you have questions about the course, or the PBAT.

Tom's afterschool days will be Mondays at 3:30pm.
He will also be available Tuesdays at 4:45pm (he has a meeting right after school.)
He is also also available Tuesday and Wednesday mornings at 8:00am.